MA Thesis
RUFA
2019
Metrome is a MA thesis project for “Visual and innovation design” course at RUFA. The project consists in a generative data-driven design system for Rome’s metro. Citizens who actively use public transport, thank to their biometric data becomes the main focus in the design process. The project crosses different design topics, building a system based on scientific studies and capable to create a human profile to the city of Rome.

The human being responds to external and internal stimuli through the nervous system that determines behavior patterns as a reaction to specific situation that is being experienced. Music is an integral part of this process as an element developed in symbiosis with man. Music can be defined as a sound that conveys emotions, and this is the project’s focal point. Metrome project places the person at the center of a system as productive organ of emotions, this happens thanks to the rhythm that each of us produces in everyday life.

Metrome is a generative design based on citizen’s data, an information exchange that generates value through everyday life. People, using a wearable device to validate tickets or passes, contribute with heart rate measured in the turnstile, to the rhythm’s generation which, associated with a flow monitoring generates an emotion for that specific hour. Made Emotion becomes the central element that interacts with all the system’s interpreters.
The algorithm’s goal is to process collected data and return a feeling. The variables taken in consideration are the heartbeat and the station’s flow. The heart rate is detected through monitoring sensors placed inside the devices worn by people to validate travel documents. Each device detects Person’s BPM on the route he travels inside the station while, an average is calculated for all people. The algorithm returns an average value that will be compared with the predetermined ranges.


The turnout’s return is processed through sensors placed in the turnstiles which have the task of counting the people who enter and leave. The algorithm’s operating scheme will be able to generate a moods scale starting from four basic feelings: sadness, joy, anger and fear.

The first technology applied is placed in the travel documents validation. This feature is available thanks to the interaction of NFC chips or proximity communication. NFC is a transceiver technology that provides short-range bidirectional wireless connectivity. It’s characterized by being small in size and very cheap.

The second technology is the so-called beacon, designed with Bluetooth technology. It allow device to transmit and receive small messages at a short distance with others device, their task is to controll who enter and leave the station, then monitoring the turnout, and check the route from the entrance to the dock.

The PPG sensor uses the technique of photoplethysmography, which is a simple optical technique that detect changes in blood volume in the peripheral circulation. PPG makes low intensity infrared (IR) light uses and it is a low cost technology which generates excellent outcome.


The person is the center of the design process. The service success is determined by the people’s usage and to do so they must be driven by defined objectives and needs.

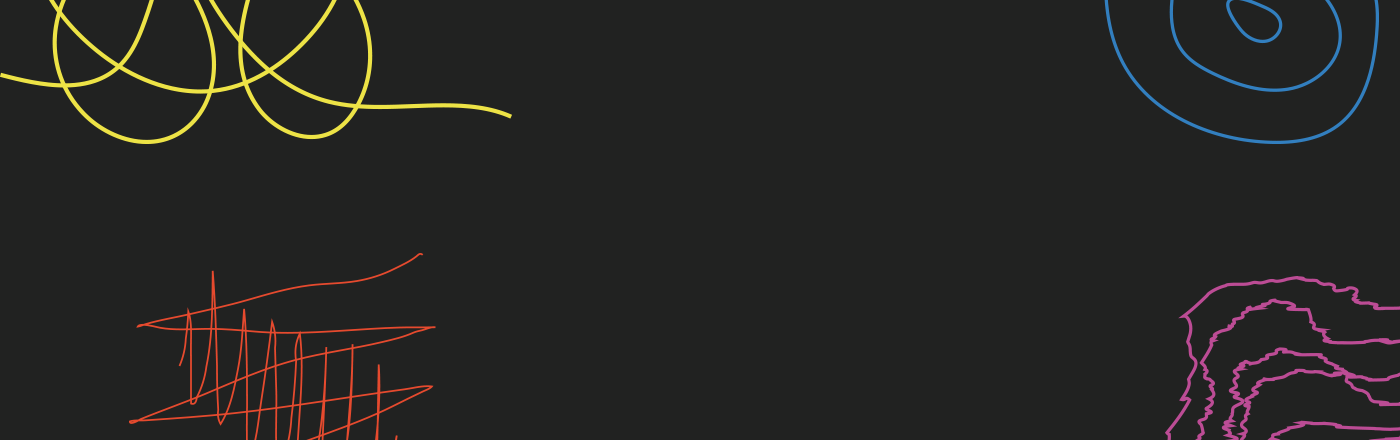
The Metrome visual system has been designed through four graphic signs characterized by the line stroke and the color. The traits that distinguish the moods have been combined with irregular shapes that return the sense of the imperfect, therefore of the human.

The colors choice took in consideration, scientific references and visual culture studied in the research phase. The reference comparison shown common chromatic characters in the color-feelings associations that determined the chromatic palette.

The logo’s function is to display data in real time. The part related the mark symbolize people’s emotions while the logotype’s thickness the flow state. Every 60 minutes the logo change its shape determined by the average data detected. There are 12 possible combinations between emotional state and type of flow.
![]()


Real time visual map shows the emotional state for each station. It allows data collection and it’s installed on a touchscreen monitor. The map use the visual system symbols to show the emotional state, while the flow is represented with three size variations.


The app is designed to support the bracelet and use the Metrome services. The designed interface always follows the emotional state of the city, making the UI dynamic.

Show all summary activities.

Shows the emotional subway map and allows data discovering.

Every hour the countdown shows the mood generated and the song extracted.

The section shows the generated music, user can browse daily playlist or those of the past days.

Travel tickets can be purchased on the App, then synchronized with the bracelet.

Profile allows the travel tickets, saved tracks and bracelet synchronization management.


